this post was submitted on 05 Feb 2024
209 points (94.1% liked)
Memes
4352 readers
101 users here now
Good memes, bad memes, unite towards a united front.
founded 5 years ago
MODERATORS
you are viewing a single comment's thread
view the rest of the comments
view the rest of the comments
I don't think you understand how the data is being calculated. Give me a second
So imagine you're drawing a graph
On the Y axis, you have growth in %
On the X axis, you have time.
Assuming you start Jan 1st 2023 with 0%
And the only other point of data is it's at 4.2% on October 1st
And you want to predict where that line goes to on December 31st. You would use a ruler to make an estimate to where the line would go, right? Like there's no reason to assume it would rise from 0% to 4.2% in 9 months then stagnate for 3 months, right?
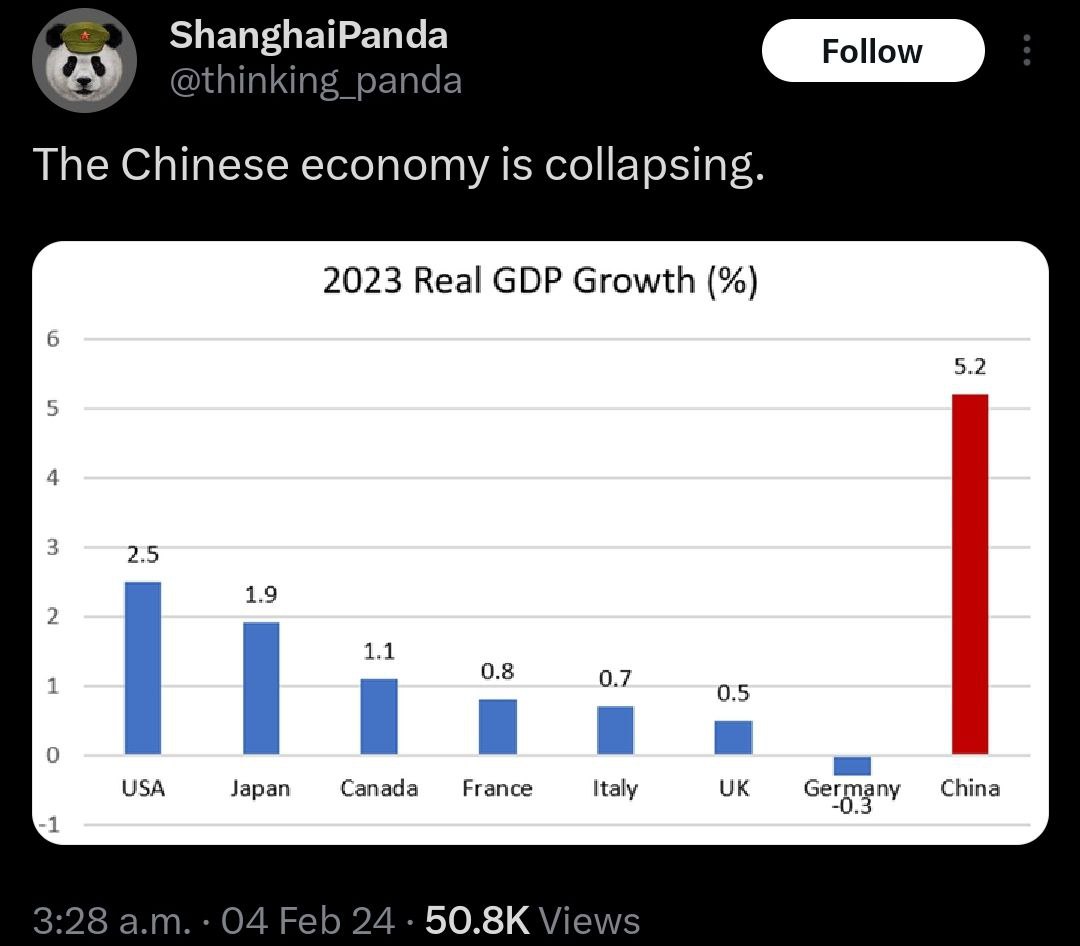
Do you define that as inflating the numbers? This Statistic graph has more in depth methodology that also estimated over 5% growth
It just kinda seems like you came into the thread with an axe to grind
Lol hey dopey I'm talking about the screenshot from Twitter
SOVIET DICTATOR "joe" biden is literally going to fukk ur mum like he FUCKS AMERICA!!!
be scared. i have received news that "an-tifa" super soldiers (???) are heading to your house through SECRET HAMAS TUNNELS
is this your last chnace to flee the countrY???