We see all the replies here:
https://floss.social/@LabPlot/112915941751314965.
LabPlot
joined 2 years ago
You can read more on boxplots here:
1
A good news: Text alignment has been recently added to #LabPlot (dev) to make labels look better.
(cdn.masto.host)
A good news: Text alignment has been recently added to #LabPlot (dev) to make labels look better.
#DataAnalysis #DataScience #Data #DataViz #Science #Statistics #FOSS #FLOSS #OpenSource

Let's just assume that the Christmas tree includes a test to check if our readers are humans 🙂
Merry Christmas from the LabPlot team! 🎅 🎄
@opensource @kde
#Christmas #FOSS #FLOSS #OpenSource #KDE #LabPlot #DataScience #DataViz
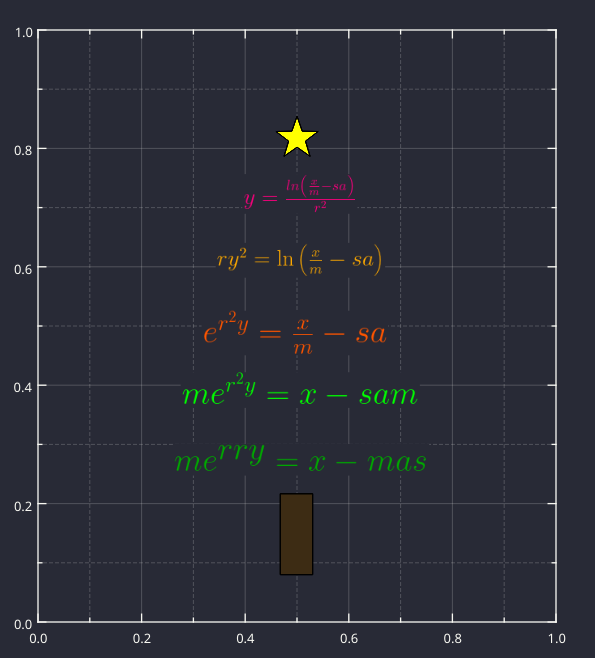
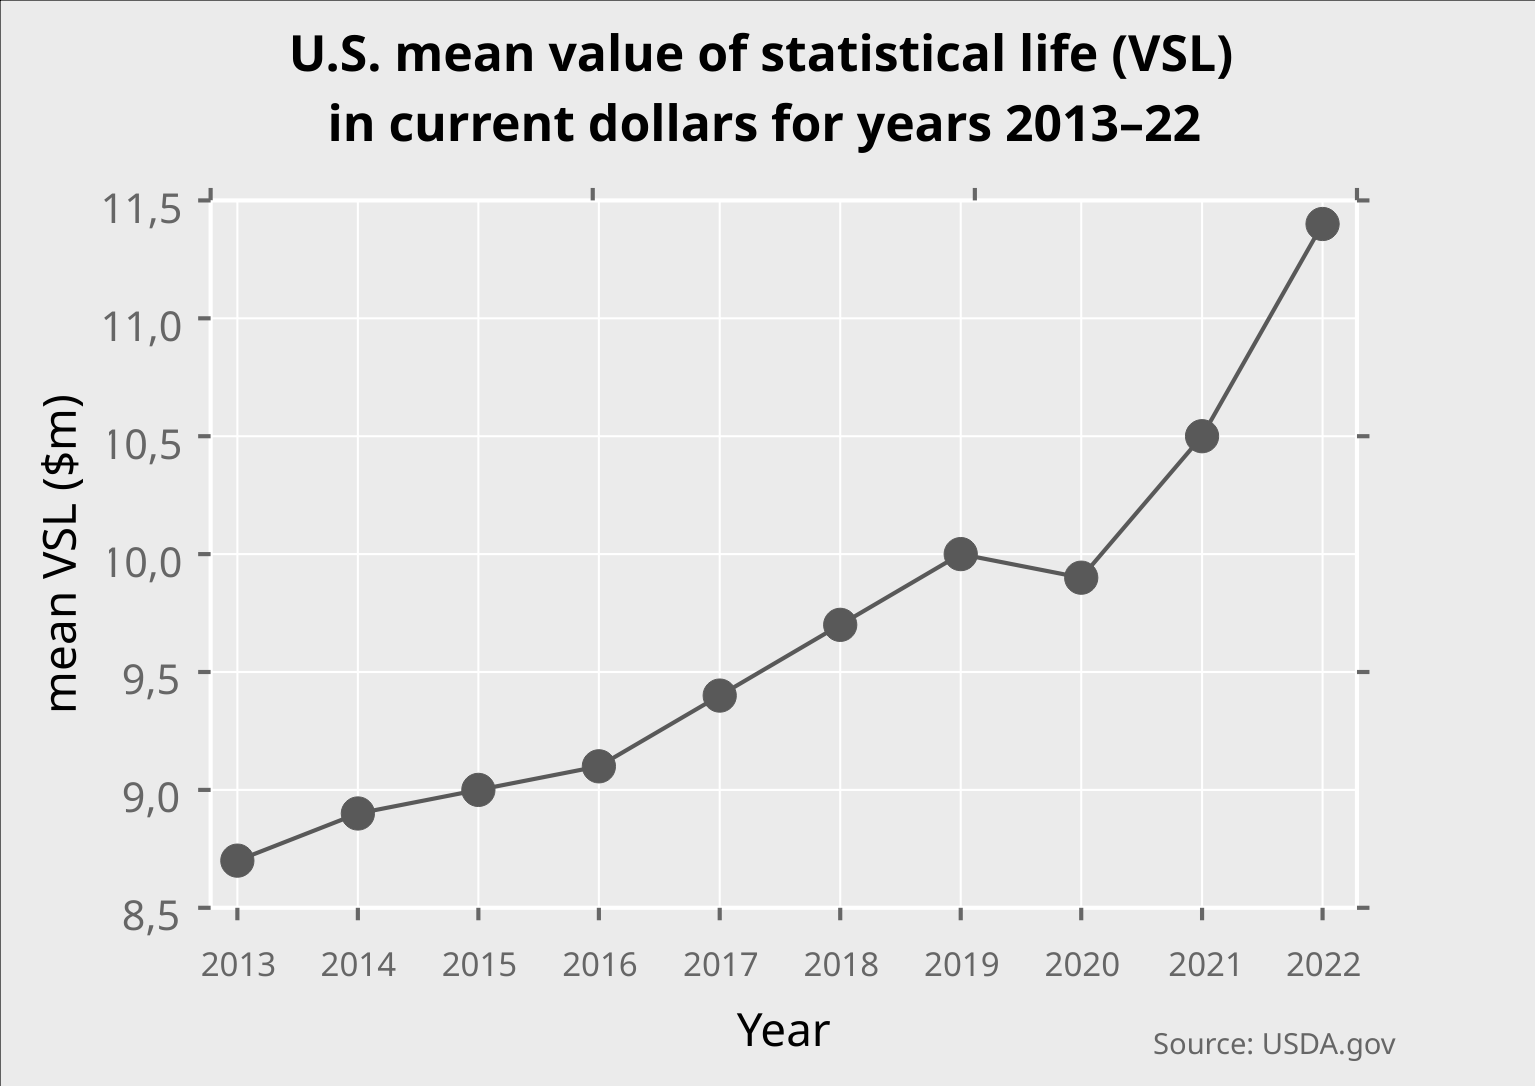
What's the value of statistical life (VSL)?
@dataisbeautiful
LabPlot ❤️ Data
➡️ https://en.wikipedia.org/wiki/Value_of_life
#DataAnalysis #DataScience #Data #DataViz #Visualization #Plotting #Statistics #Life #Risk #Safety #Security
#USA #USDA #FOSS #OpenSource #FLOSS #VSL
16
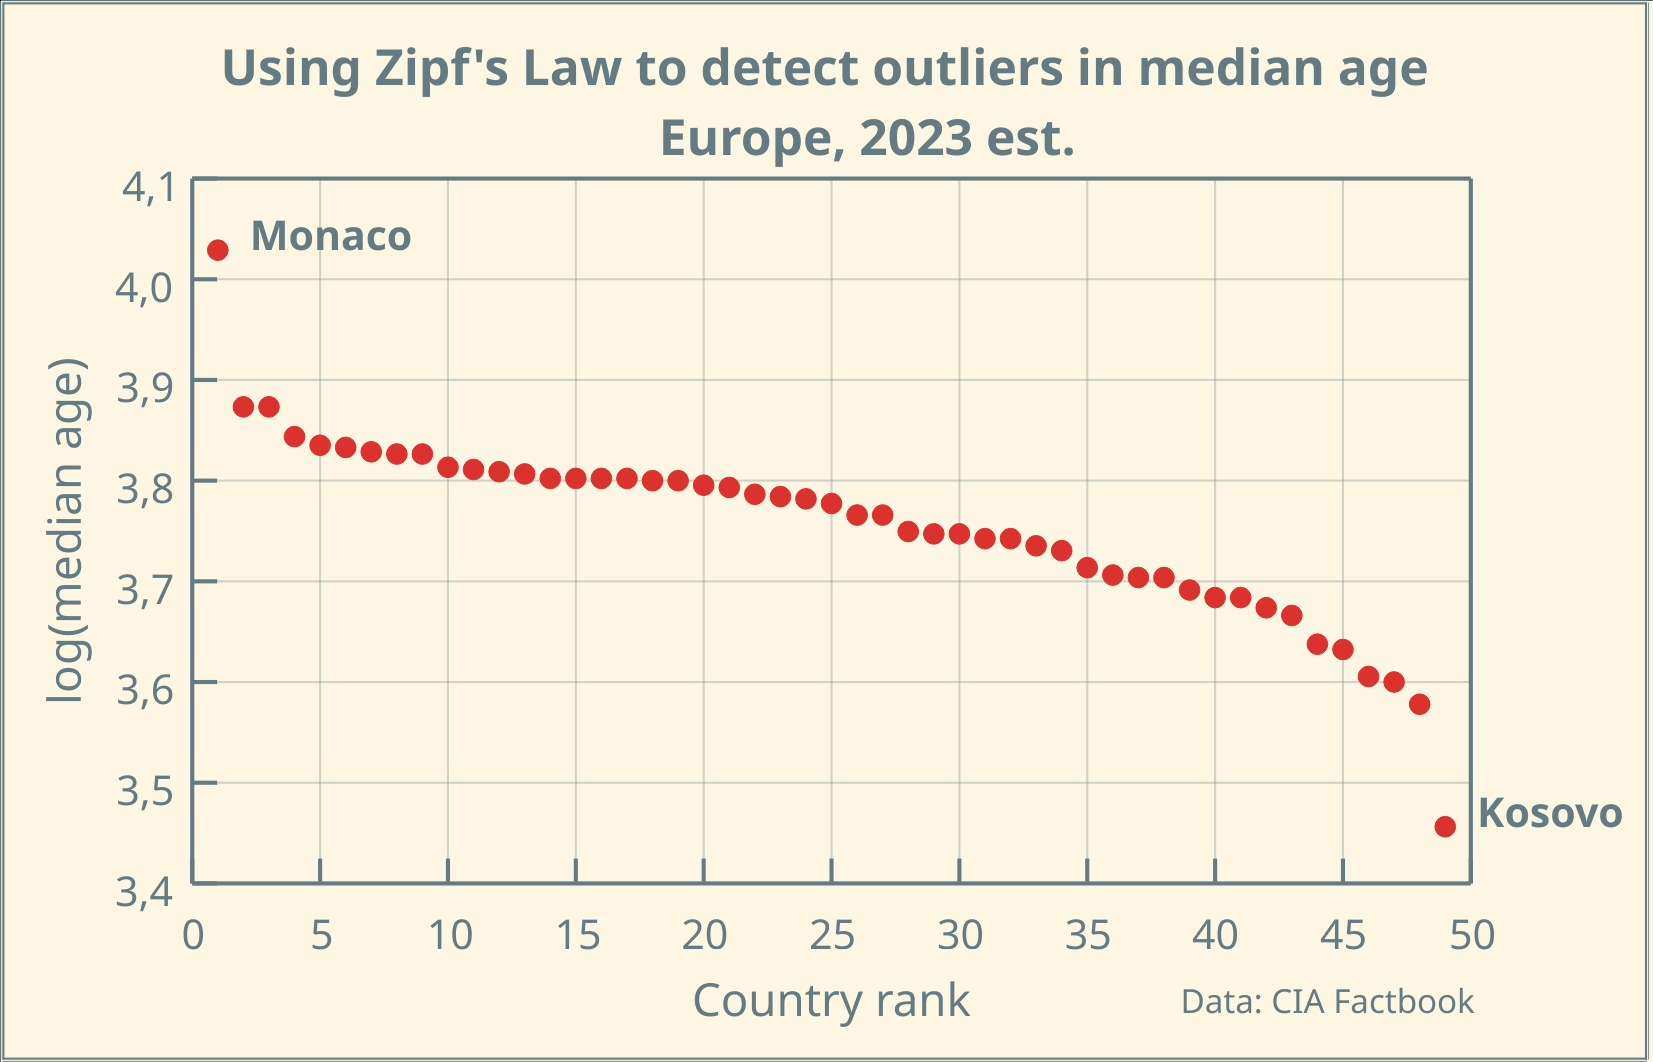
Using Zipf's Law to detect outliers in median age of European Countries in #LabPlot (2023 est.)
(cdn.masto.host)
Using Zipf's Law to detect outliers in median age of European Countries in #LabPlot (2023 est.)
LabPlot ❤️ Data
➡️ https://en.wikipedia.org/wiki/Zipf%27s_law
#DataAnalysis #DataScience #Data #DataViz #Visualization #Plotting #Statistics #Age #Europe #FOSS #OpenSource
Did you know that you can work with Jupyter notebooks directly in LabPlot?
For example, let's open the following notebook to see how it works in #labplot
👉 https://github.com/demotu/BMC/blob/master/notebooks/Statistics-Descriptive.ipynb
#DataAnalysis #DataScience #Data #DataViz #Visualization #Plotting #Science #Statistics #FOSS #OpenSource #Python #Jupyter

The process average X and control limits are added to the plot for men. The average is 63.4. The upper control limit (UCL) is 64.8 and the lower control limit (LCL) is 62.0.
The UCL represents the largest value you would expect if you only have common causes of variation present. The LCL represents the smallest value you would expect if you only have common causes of variation present.
@dataisbeautiful !health@lemmy.world !labplot@lemmy.kde.social
@Generous1146
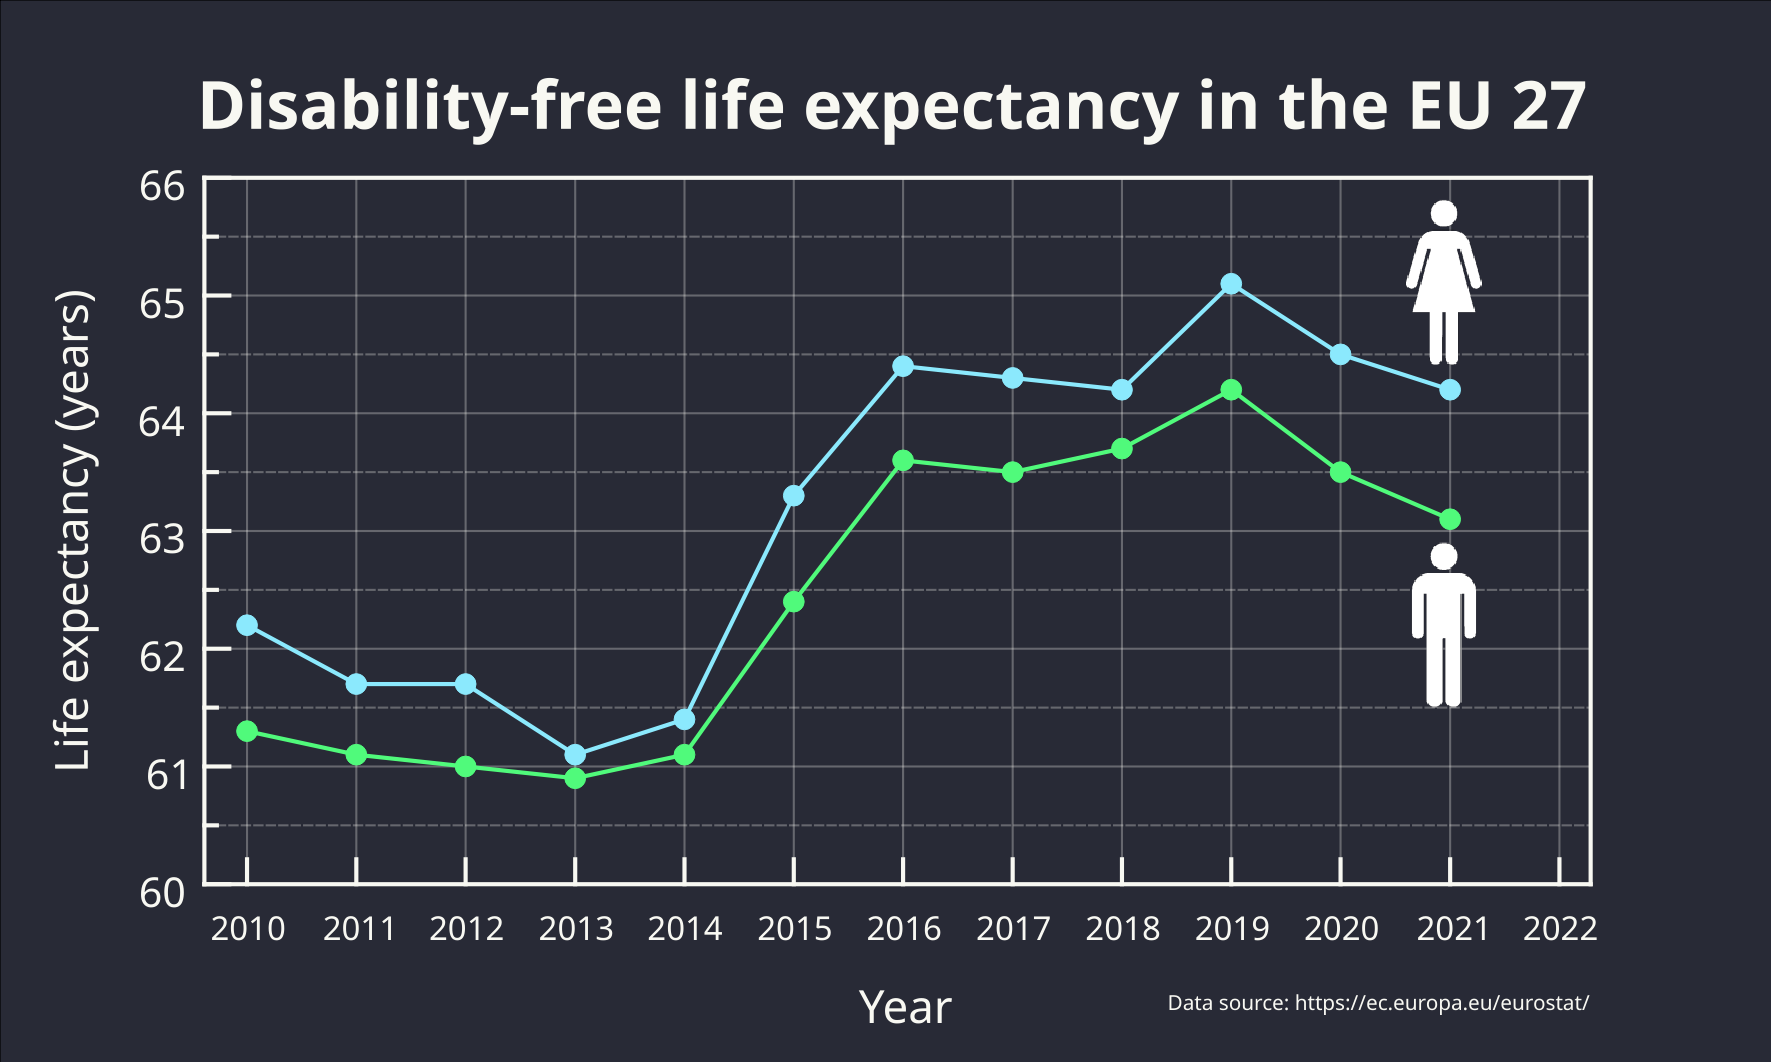
Actually, it looks more like the disability-free life expectancy has increased in 2015 and since then stays at about the same level.
#DataViz #Statistics #Visualization #Health #Disability #LabPlot #OpenSource #FOSS
@dataisbeautiful @health @labplot@lemmy.kde.social
According to the Eurostat, in 2021, the number of healthy life years at birth was estimated at 64.2 years for women and 63.1 years for men in the EU, this represented approximately 77.4 % and 81.7 % of the total life expectancy for women and men.
Disability-free life expectancy in the EU 27
@dataisbeautiful
!health@lemmy.world
!labplot@lemmy.kde.social
LabPlot ❤️ Data
#DataViz #Statistics #Visualization #Health #Disability #LabPlot #OpenSource #FOSS #DraculaTheme
Is the act of distinguishing a question from an answer as difficult as recognizing spurious correlations?
The question has been raised earlier by others,. See for example this paper from 2021 (Measuring the effect of energy consumption on the epidemic
of overweight in Latin America and Caribbean countries):
@Sconrad122
Any exploratory plot forms a question and your comment shows how to look for answers. Thanks!