The process of actually projecting the contours on the globe onto a flat (cylindrical) map is by either putting a strong light source inside the globe and place the paper cylinder around it. This projects the contours onto the cylinder. The contours then need to be traced onto the cylinder using a pen. The other option, e.g. if the globe isn't translucent, is to paint a longitude/latitude grid onto it and start with an empty rectangular map with the same grid structure. Then, for every trapezoid on the globe, its content needs to be transferred to ~~a~~ the coresponding rectangle on the map.
this post was submitted on 22 Feb 2025
17 points (94.7% liked)
Map Enthusiasts
3807 readers
29 users here now
For the map enthused!
Rules:
-
post relevant content: interesting, informative, and/or pretty maps
-
be nice
founded 2 years ago
MODERATORS
I'm not a cartographer, but the way I'd tackle this is to drill a small hole in the globe and spray paint in through it, so that the inner surface is opaque white. Then I would put together a cheap turntable-style 3D scanner using an off-the-shelf camera (there are open source designs available for this that you can buy as a kit or print using a 3D printer, then assemble following step-by-step instructions). Then, after scanning the globe and obtaining a textured 3D model of it, it should be relatively easy to convert the globe's texture from a spherical shape to a standard map projection using software. I don't know what software that would be offhand, but I'm sure it exists.
Any projection is a compromise. You conserve some properties at the cost of others.
You could always start with a mercator projection. They are easy enough to make (think cylinder wrapped tightly around the 'equator' of your globe.
Or you could go with a conic projection (think cone sitting on a gloabe like a hat) which are also simple to make. Lambert conformal conics are common in aeronautical charts.
Both of these projections are used in different maps in the real world for navigation.
Edit: Go for a browse; there are plenty of different flavors https://en.m.wikipedia.org/wiki/List_of_map_projections If your using software, then you can kinda do whatever you want without worrying about how hard or easy it is to make. 😄
Eh.

Not quite what i meant haha: A conic projection uses a 3D cone laid over the top of a 3D globe and then the cone is spread out on a flat surface, rather then the map itself being a cone as you have done above.
The videos below might help illustrate what i mean.
Some relevent Videos:
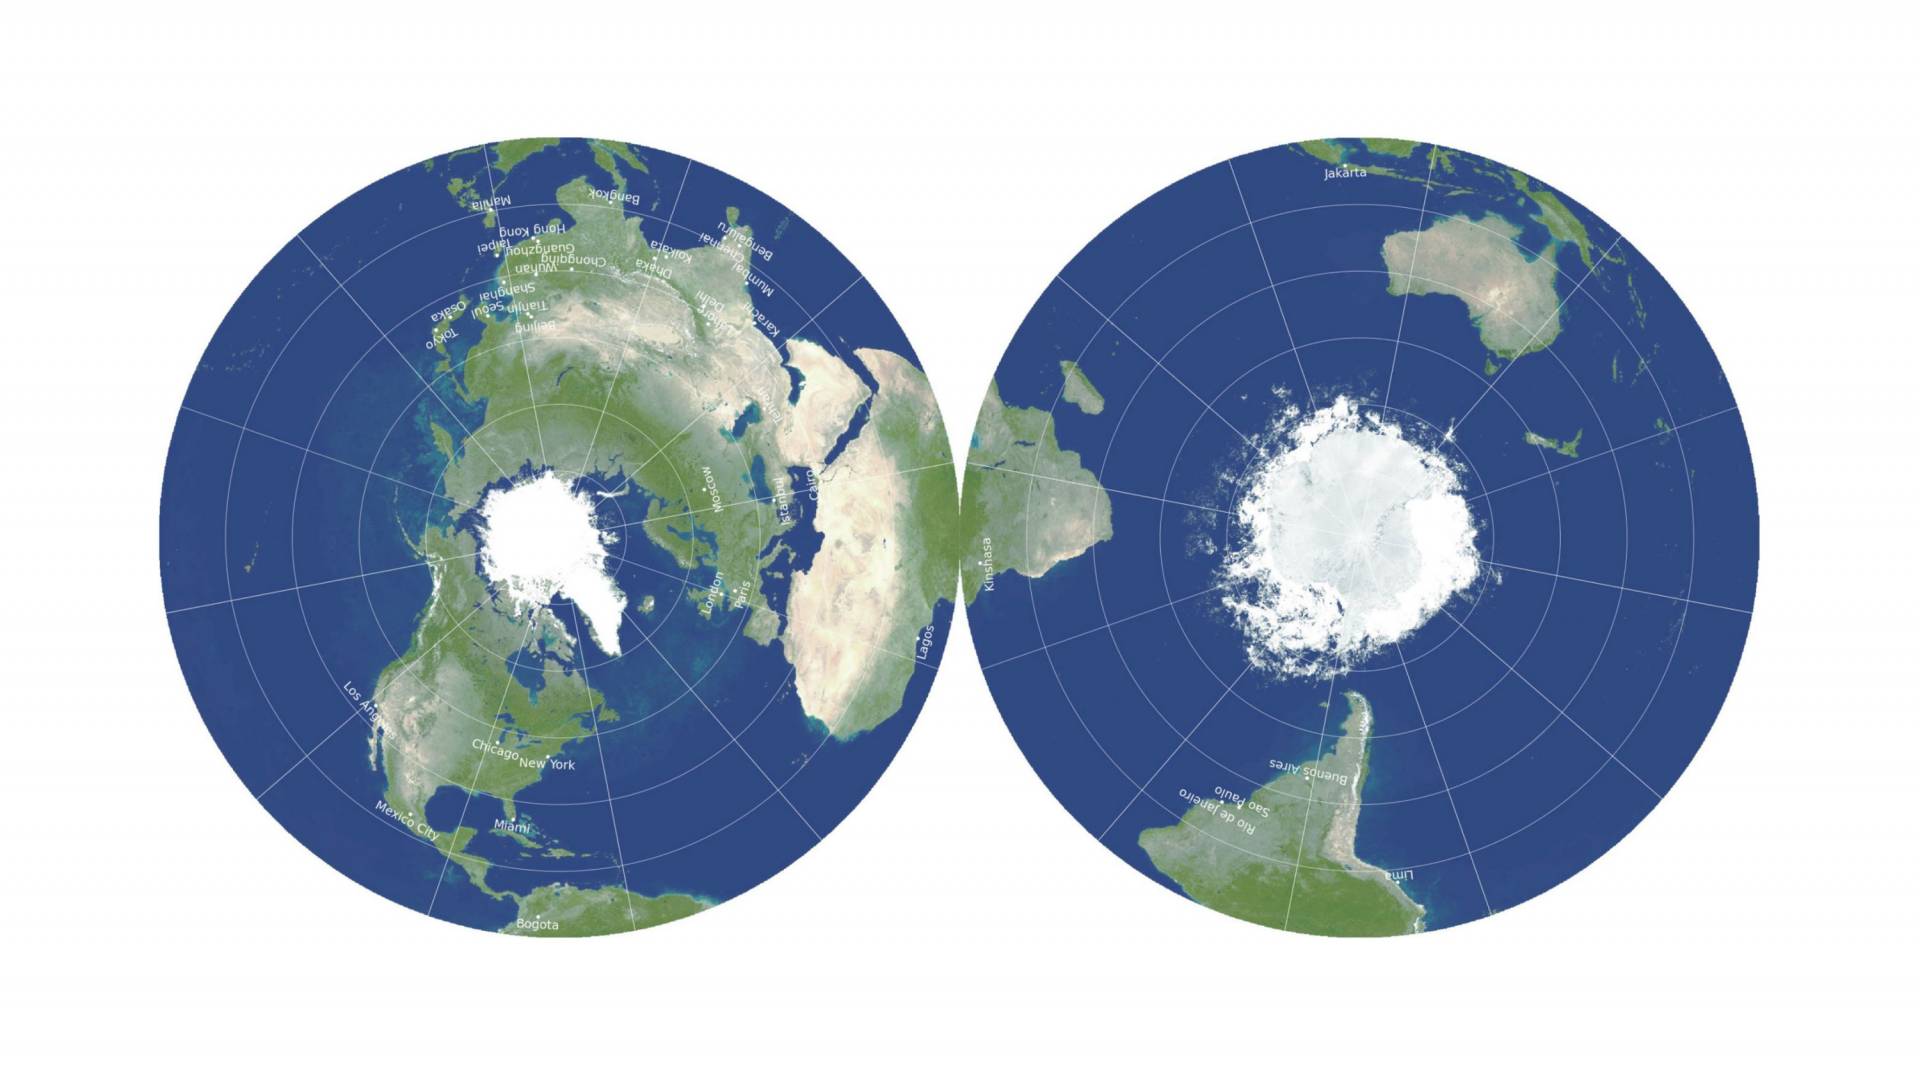
Objectively, the Gott, Goldberg, and Vanderbel projection method distorts the least.
Unless you're Icelandic
For some definition of "least".
Using their own scoring system for distortion, a globe would be a 0, a Mercator projection would be 8.296, Winkel Tripel is a 4.563, and their projection would be a 0.881.
That's interesting, though their own map benefits from their definition of B (the number of boundary cuts an arbitrary line segment needs to cross), because this metric does not take into account how far away the elements on the map are from each other. E.g. the cuts going from northern to southern Africa count as much as a "distortion" as the ones separating Indonesia and South America.
Ultimately, "objective" best depends on the metric you choose and that is a subjective decision.
Agreed, this map isn't particularly usable to the average person.
Well, gee, thanks for the rabbit hole!
The AuthaGraph is considered the most accurate flat map from a globe.
I guess you want a projection that distorts your oceans whilst keeping your land masses as proportional as possible, right?
Very good point. It would depend entirely on the locations of the land masses on OP’s globe.
Better than Butterfly? Better than Dymaxion??