this post was submitted on 27 Apr 2024
692 points (97.7% liked)
Data Is Beautiful
8473 readers
1 users here now
A place to share and discuss data visualizations. #dataviz
founded 4 years ago
MODERATORS
you are viewing a single comment's thread
view the rest of the comments
view the rest of the comments
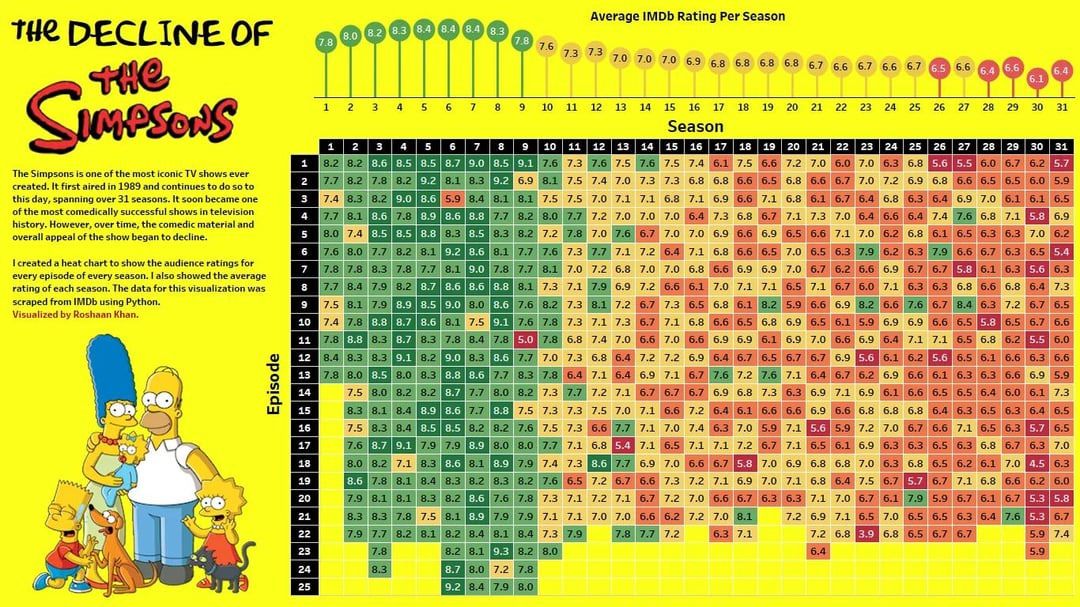
The graphic shows a stellar first 9 seasons, a medium next 15 seasons, and a terrible last 8 seasons... so the majority of them are medium with equal about good and bad episodes.