Datos y visualizaciones
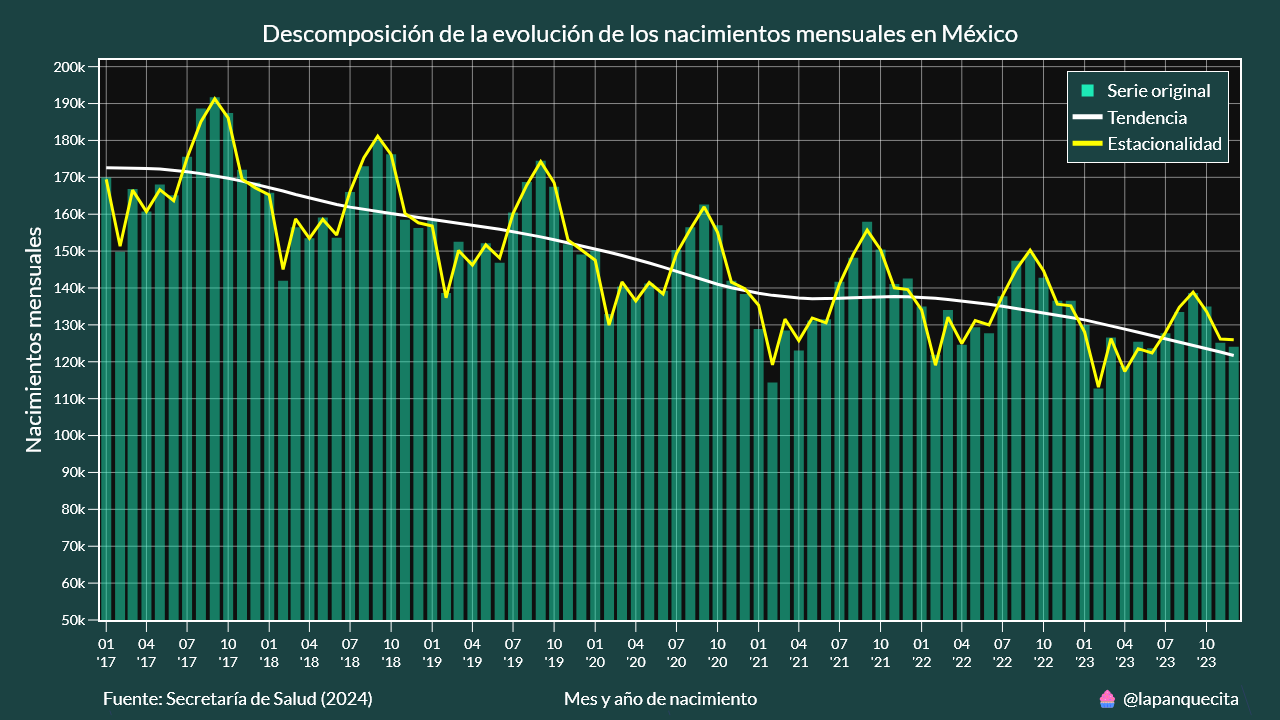
para esta gráfica utilicé todos los registros de natalidad de la Secretaría de Salud (2008-2023) y luego apliqué una descomposición mediante suavizado LOESS
la línea blanca es la importante, ya que muestra las cifras sin los efectos estacionales
fuente: http://www.dgis.salud.gob.mx/contenidos/basesdedatos/da_nacimientos_gobmx.html